Complete Guide to AWS EC2 Alarms and Monitoring
I am a Software Developer from Italy.
Introduction
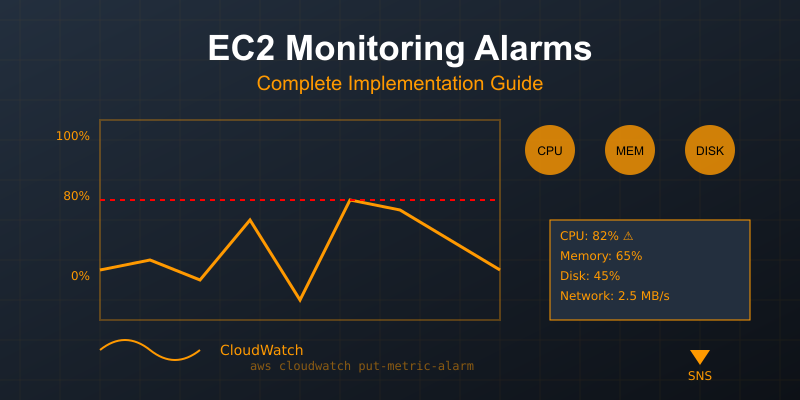
Setting up proper EC2 alarms is crucial for maintaining healthy applications. This guide covers everything from basic CPU monitoring to complex custom metrics.
Basic CloudWatch Alarms
1. CPU Utilization Alarm
bashCopyaws cloudwatch put-metric-alarm \
    --alarm-name high-cpu-usage \
    --alarm-description "Alarm when CPU exceeds 80%" \
    --metric-name CPUUtilization \
    --namespace AWS/EC2 \
    --statistic Average \
    --period 300 \
    --threshold 80 \
    --comparison-operator GreaterThanThreshold \
    --evaluation-periods 2 \
    --dimensions Name=InstanceId,Value=i-1234567890abcdef0 \
    --alarm-actions arn:aws:sns:region:account-id:topic-name
2. Memory Usage Alarm
yamlCopy# CloudWatch Agent Configuration
{
  "metrics": {
    "metrics_collected": {
      "mem": {
        "measurement": [
          "mem_used_percent"
        ],
        "metrics_collection_interval": 60
      }
    }
  }
}
3. Disk Space Alarm
bashCopyaws cloudwatch put-metric-alarm \
    --alarm-name low-disk-space \
    --alarm-description "Alarm when disk space is below 20%" \
    --metric-name DiskSpaceUtilization \
    --namespace System/Linux \
    --statistic Average \
    --period 300 \
    --threshold 20 \
    --comparison-operator LessThanThreshold \
    --evaluation-periods 1 \
    --dimensions Name=InstanceId,Value=i-1234567890abcdef0 \
    --alarm-actions arn:aws:sns:region:account-id:topic-name
Advanced Monitoring Configurations
1. Status Check Alarms
jsonCopy{
    "MetricAlarms": [
        {
            "AlarmName": "EC2-StatusCheckFailed",
            "AlarmDescription": "Status check failure monitoring",
            "MetricName": "StatusCheckFailed",
            "Namespace": "AWS/EC2",
            "Statistic": "Maximum",
            "Period": 60,
            "EvaluationPeriods": 2,
            "Threshold": 0,
            "ComparisonOperator": "GreaterThanThreshold",
            "AlarmActions": ["arn:aws:sns:region:account-id:topic-name"],
            "Dimensions": [
                {
                    "Name": "InstanceId",
                    "Value": "i-1234567890abcdef0"
                }
            ]
        }
    ]
}
2. Network Traffic Monitoring
pythonCopy# Python script to create network monitoring alarm
import boto3

cloudwatch = boto3.client('cloudwatch')

def create_network_alarm(instance_id, threshold):
    response = cloudwatch.put_metric_alarm(
        AlarmName='High-Network-Traffic',
        AlarmDescription='Alarm for excessive network traffic',
        MetricName='NetworkOut',
        Namespace='AWS/EC2',
        Statistic='Average',
        Period=300,
        EvaluationPeriods=2,
        Threshold=threshold,
        ComparisonOperator='GreaterThanThreshold',
        Dimensions=[
            {
                'Name': 'InstanceId',
                'Value': instance_id
            }
        ],
        AlarmActions=['arn:aws:sns:region:account-id:topic-name']
    )
    return response
Custom Metrics
1. Application-Level Monitoring
bashCopy# Send custom metric using AWS CLI
aws cloudwatch put-metric-data \
    --namespace "CustomApplicationMetrics" \
    --metric-name "ActiveUsers" \
    --value 42 \
    --dimensions Instance=i-1234567890abcdef0

# Create alarm for custom metric
aws cloudwatch put-metric-alarm \
    --alarm-name high-active-users \
    --metric-name ActiveUsers \
    --namespace CustomApplicationMetrics \
    --statistic Average \
    --period 300 \
    --threshold 100 \
    --comparison-operator GreaterThanThreshold \
    --evaluation-periods 2 \
    --alarm-actions arn:aws:sns:region:account-id:topic-name
2. Process Monitoring
yamlCopy# CloudWatch Agent Configuration for Process Monitoring
{
  "metrics": {
    "metrics_collected": {
      "procstat": [
        {
          "pattern": "nginx",
          "measurement": [
            "cpu_usage",
            "memory_rss",
            "read_bytes",
            "write_bytes"
          ]
        }
      ]
    }
  }
}
Auto Scaling Integration
1. Scale-Out Alarm
jsonCopy{
    "AlarmName": "Scale-Out-CPU-High",
    "AlarmDescription": "Scale out when CPU > 80%",
    "MetricName": "CPUUtilization",
    "Namespace": "AWS/EC2",
    "Statistic": "Average",
    "Period": 300,
    "EvaluationPeriods": 2,
    "Threshold": 80,
    "ComparisonOperator": "GreaterThanThreshold",
    "AlarmActions": ["arn:aws:autoscaling:region:account-id:scalingPolicy:policy-id:autoScalingGroupName/group-name:policyName/scale-out-policy"]
}
2. Scale-In Alarm
jsonCopy{
    "AlarmName": "Scale-In-CPU-Low",
    "AlarmDescription": "Scale in when CPU < 30%",
    "MetricName": "CPUUtilization",
    "Namespace": "AWS/EC2",
    "Statistic": "Average",
    "Period": 300,
    "EvaluationPeriods": 2,
    "Threshold": 30,
    "ComparisonOperator": "LessThanThreshold",
    "AlarmActions": ["arn:aws:autoscaling:region:account-id:scalingPolicy:policy-id:autoScalingGroupName/group-name:policyName/scale-in-policy"]
}
Notification Setup
1. SNS Topic Creation
bashCopy# Create SNS topic
aws sns create-topic --name ec2-alarms

# Subscribe email to topic
aws sns subscribe \
    --topic-arn arn:aws:sns:region:account-id:ec2-alarms \
    --protocol email \
    --notification-endpoint your-email@example.com
2. Lambda Integration for Custom Notifications
pythonCopyimport boto3
import json

def lambda_handler(event, context):
    # Parse CloudWatch alarm message
    message = json.loads(event['Records'][0]['Sns']['Message'])

    # Send to Slack/Teams/etc
    webhook_url = 'YOUR_WEBHOOK_URL'

    alarm_name = message['AlarmName']
    alarm_description = message['AlarmDescription']
    new_state = message['NewStateValue']

    notification = {
        'text': f"Alarm: {alarm_name}\nStatus: {new_state}\nDescription: {alarm_description}"
    }

    # Send notification (implementation depends on your notification service)
Best Practices
1. Alarm Naming Convention
plaintextCopy[Environment]-[Service]-[Resource]-[Metric]-[Threshold]
Example: prod-ec2-web-cpu-80
2. Tagging Strategy
jsonCopy{
    "Tags": [
        {
            "Key": "Environment",
            "Value": "Production"
        },
        {
            "Key": "MonitoringLevel",
            "Value": "Enhanced"
        },
        {
            "Key": "CostCenter",
            "Value": "IT-123"
        }
    ]
}
3. Alarm Actions Matrix
yamlCopyCritical:
  - SNS notification to on-call team
  - Auto-recovery action
  - Incident ticket creation

Warning:
  - SNS notification to dev team
  - Log to monitoring dashboard

Info:
  - Log to monitoring dashboard
  - Weekly report generation
Common Troubleshooting
1. Missing Data Points
bashCopy# Check metric data availability
aws cloudwatch get-metric-statistics \
    --namespace AWS/EC2 \
    --metric-name CPUUtilization \
    --dimensions Name=InstanceId,Value=i-1234567890abcdef0 \
    --start-time $(date -u +%Y-%m-%dT%H:%M:%S -d '3 hours ago') \
    --end-time $(date -u +%Y-%m-%dT%H:%M:%S) \
    --period 300 \
    --statistics Average
2. Alarm State Verification
bashCopy# Check alarm state
aws cloudwatch describe-alarms \
    --alarm-names high-cpu-usage

# Check alarm history
aws cloudwatch describe-alarm-history \
    --alarm-name high-cpu-usage
Cost Optimization
Basic Monitoring: Free 5-minute intervals
Detailed Monitoring: Paid 1-minute intervals
Custom Metrics: $0.30 per metric per month
API Requests: First 1 million requests free
Monitoring Checklist
Basic metrics configured (CPU, Memory, Disk)
Custom metrics identified and implemented
Appropriate thresholds set
Notification channels configured
Auto-scaling integration tested
Cost analysis completed
Documentation updated
Team trained on response procedures
Remember: The key to effective EC2 monitoring is finding the right balance between comprehensive coverage and alert fatigue. Start with essential metrics and gradually add more based on your application's needs.
#AWS #EC2 #Monitoring #DevOps #CloudWatch